Perf Event is a performance diagnostic tool that is released and maintained with the Linux kernel code. Perf can not only be used to analyze the performance of program, but it can also be used to analyze the performance of Linux kernel.
introduction
Perf a tool to analyze performance of program. We can use PMU,tracepoint and special counters in kernel to summarize the performance. With perf we can analyze the hardware event at the running time of programs, such as instructions retired and processor clock cycles. You can also analyze software events, such as Page Fault and the switch of process.
These features make Perf has many abilities to analyze. For example, you can count each instructions in a clock cycle, which called IPC. Lower IPC means the code does not make good use of CPU. Perf can also get function-level sampling of program, so as to understand where is the performance bottlenecks of the program. Perf can also do benchmark to measure the performance of scheduler.
- Hardware Events
- Software Events
- Kernel Tracepoint Events
- User Statically-Defined Tracing (USDT)
- Dynamic Tracing
- Timed Profiling
background
There are many aspects that can affect the performance of program. For example, if some program can not make full use of cache, the performance will decline.
a. hardware feature - cache;Cache is a kind of SRAM, and has a quite high-speed I/O. It is an important part to make full use of cache in improving
- PMU = performance monitoring unit
- PMCs = performance monitoring counters
- PICs = performance instruction counters
b. pipeline & superscalar & run out of order;
The best way to improve performance is parallelization. The cpu can do parallel work in hardware, such as pipeline.
- IPC = instruction per cycle
- CPI = cycles per instruction
- SCPI = stalled cycles per instruction
c. PMU;There is a PMU unit in hardware, which means performance monitor unit. This unit allows software to set counter according some hardware events, and then the cpu begins to summarize the counts of that event. When the counts is bigger then the number set inside, an interrupt will occur.
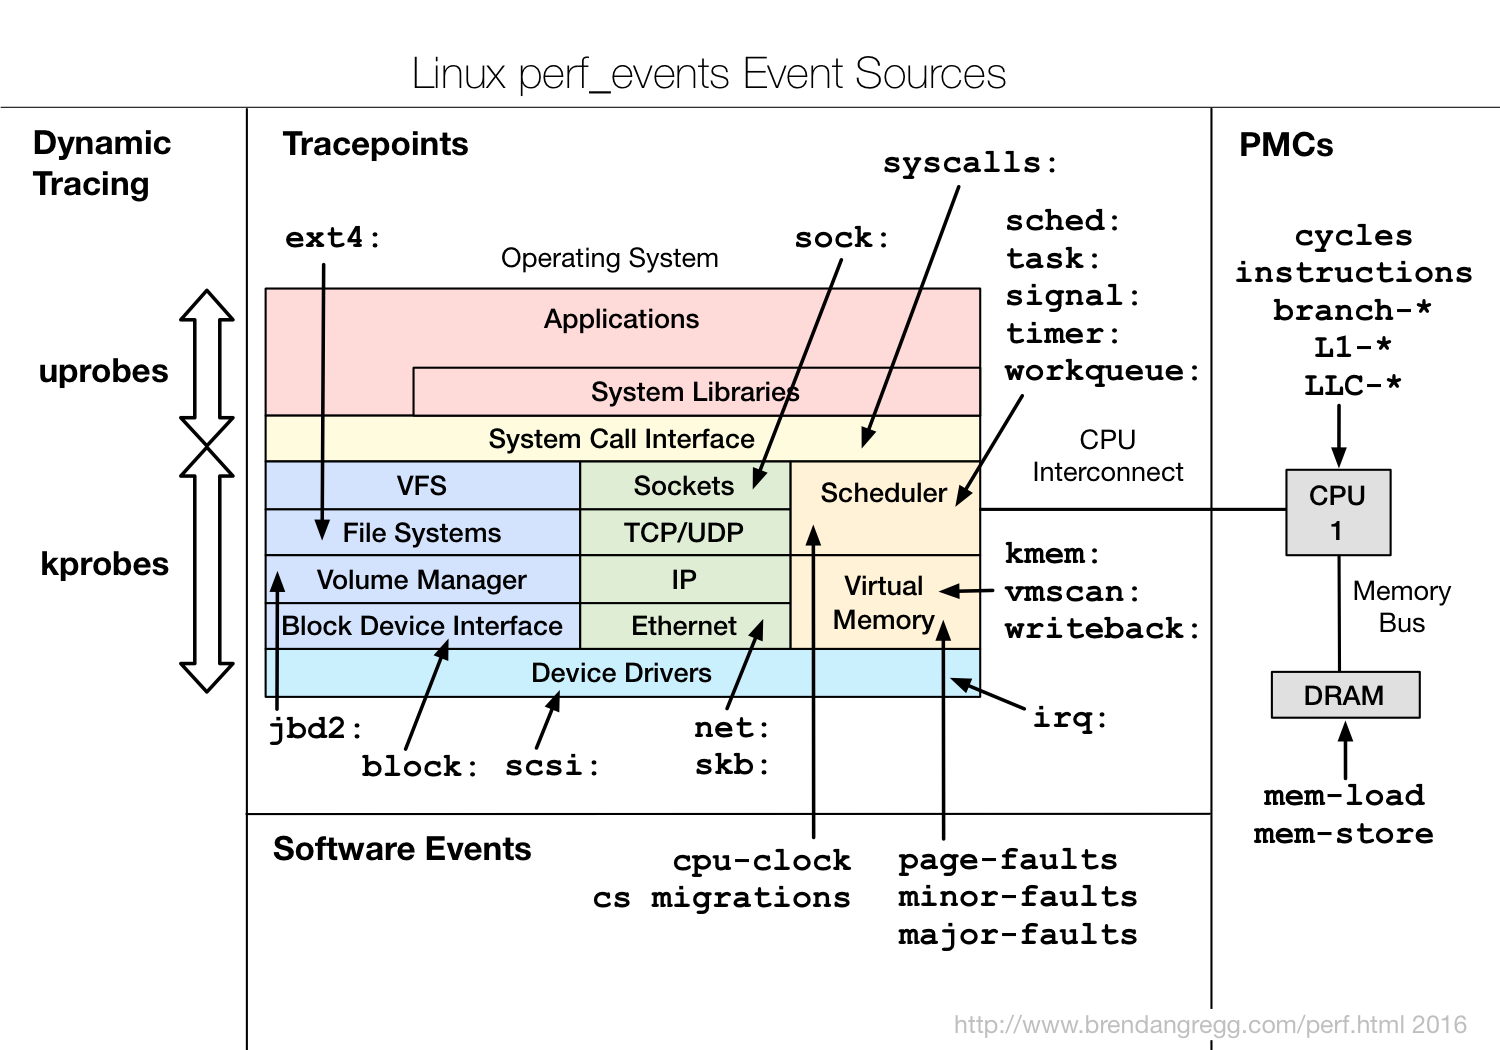
d. Tracepoints;Tracepoint is some hooks in linux kernel, once it is enabled, it can be triggered when some certain code runs. This feature can be applied to many kinds of trace/debug tools. For example, if you want to know the events in memory manage module, then you can use the tracepoint in slab allocator, and when the kernel get to these tracepoints, it will notify perf.
- block : block device I/O
- ext4 : file system operations
- kmem : kernel memory allocation events
- random : kernel random number generator events
- sched : CPU scheduler events
- syscalls : system call enter and exits
- task : task events
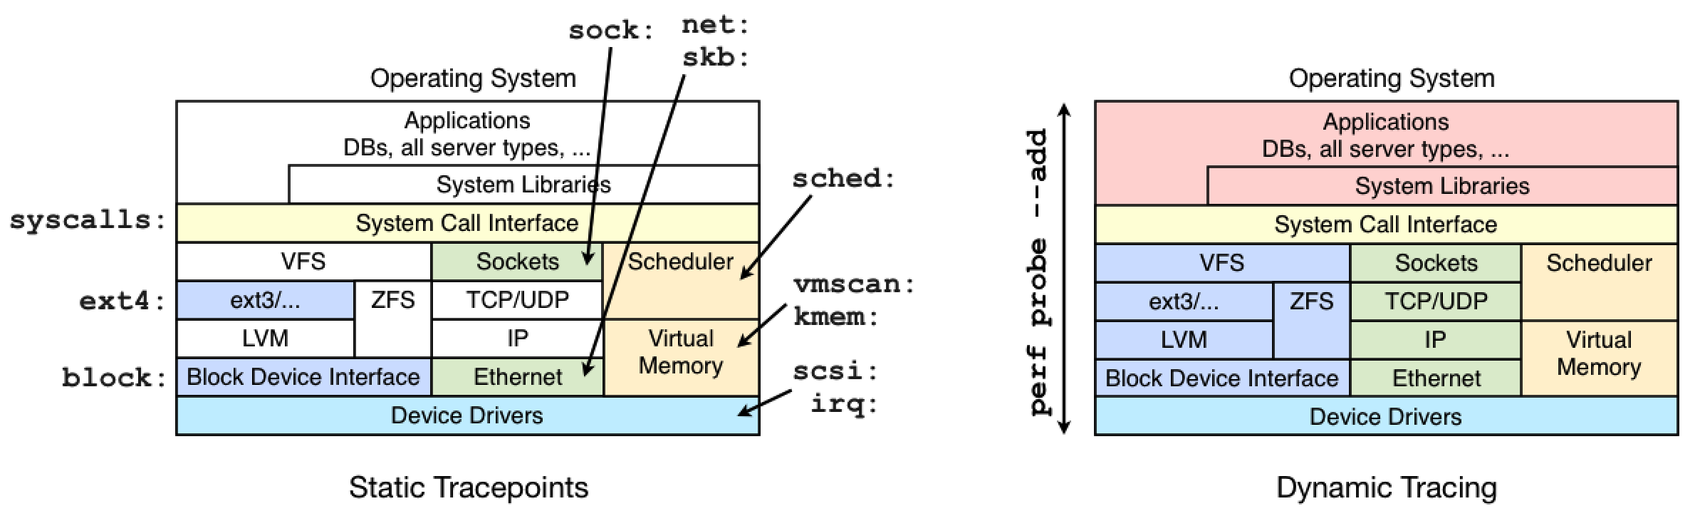
Notice: Dynamic tracing is unstable, it may break after a kernel update or patch. So use static tracepoints first. But dynamic tracing is useful to an already_running kernel or application.
Basic use of Perf
You should install perf before using it, to do this you will have to get a distribution of linux higher then 2.6.31. Enter the tools/perf directory and then
- make
- make install
perf list
You can use perf list to list all the events that can trigger the perf sampling.
List of pre-defined events (to be used in -e):

  branch-instructions OR cpu/branch-instructions/    [Kernel PMU event]
  branch-misses OR cpu/branch-misses/                [Kernel PMU event]
  bus-cycles OR cpu/bus-cycles/                      [Kernel PMU event]
  cache-misses OR cpu/cache-misses/                  [Kernel PMU event]
  cache-references OR cpu/cache-references/          [Kernel PMU event]
  cpu-cycles OR cpu/cpu-cycles/                      [Kernel PMU event]
  cstate_core/c3-residency/                          [Kernel PMU event]
  cstate_core/c6-residency/                          [Kernel PMU event]
  cstate_core/c7-residency/                          [Kernel PMU event]
  cstate_pkg/c2-residency/                           [Kernel PMU event]
  cstate_pkg/c3-residency/                           [Kernel PMU event]
  cstate_pkg/c6-residency/                           [Kernel PMU event]
  cstate_pkg/c7-residency/                           [Kernel PMU event]
  instructions OR cpu/instructions/                  [Kernel PMU event]
  intel_bts//                                        [Kernel PMU event]
  mem-loads OR cpu/mem-loads/                        [Kernel PMU event]
  mem-stores OR cpu/mem-stores/                      [Kernel PMU event]
  cstate_core/c3-residency/                          [Kernel PMU event]
  cstate_core/c6-residency/                          [Kernel PMU event]
  cstate_core/c7-residency/                          [Kernel PMU event]
  msr/tsc/                                           [Kernel PMU event]
  power/energy-cores/                                [Kernel PMU event]
  power/energy-gpu/                                  [Kernel PMU event]
  power/energy-pkg/                                  [Kernel PMU event]
  ref-cycles OR cpu/ref-cycles/                      [Kernel PMU event]
  stalled-cycles-frontend OR cpu/stalled-cycles-frontend/ [Kernel PMU event]
  topdown-fetch-bubbles OR cpu/topdown-fetch-bubbles/ [Kernel PMU event]
  topdown-recovery-bubbles OR cpu/topdown-recovery-bubbles/ [Kernel PMU event]
  topdown-slots-issued OR cpu/topdown-slots-issued/  [Kernel PMU event]
  topdown-slots-retired OR cpu/topdown-slots-retired/ [Kernel PMU event]
  topdown-total-slots OR cpu/topdown-total-slots/    [Kernel PMU event]
  uncore_cbox_0/clockticks/                          [Kernel PMU event]
  uncore_cbox_1/clockticks/                          [Kernel PMU event]
  uncore_imc/data_reads/                             [Kernel PMU event]
  uncore_imc/data_writes/                            [Kernel PMU event]
  mem:< addr>[/len][:access]                          [Hardware breakpoint]
Here is a example programe for us to use perf to count the performance.
//test.c
 void longa()
 {
   int i,j;
   for(i = 0; i <  1000000; i++)
   j=i; //am I silly or crazy? I feel boring and desperate.
 }

 void foo2()
 {
   int i;
   for(i=0 ; i <  10; i++)
        longa();
 }

 void foo1()
 {
   int i;
   for(i = 0; i<  100; i++)
      longa();
 }

 int main(void)
 {
   foo1();
   foo2();
 }
There are many reasons causing program to run slow. Some use the cpu most of running time, calls CPU bound, others have much I/O work calls IO bound.
We can do gcc -o t1 -g test.c to compile the file. And then use the perf stat to analyze data.
perf stat
$perf stat ./t1
Performance counter stats for './t1':

       256.000035      task-clock (msec)         #    0.993 CPUs utilized
               11      context-switches          #    0.043 K/sec
                0      cpu-migrations            #    0.000 K/sec
               42      page-faults               #    0.164 K/sec
      776,120,868      cycles                    #    3.032 GHz
      556,491,026      stalled-cycles-frontend   #   71.70% frontend cycles idle
      550,825,779      instructions              #    0.71  insn per cycle
                                                 #    1.01  stalled cycles per insn
      110,154,137      branches                  #  430.290 M/sec
            8,726      branch-misses             #    0.01% of all branches

      0.257805071 seconds time elapsed

#IPC: Instructions/Cycles  (bigger is better, making full use of cpu)
# by -e you can find some special events
These data tells us that the program t1 is CPU bound, because task-clock(msec) is 0.993 and close to 1, which means most of its time are CPU bound work.
perf top
This function can be used to observe current performance of the system.For example we use the following code to as process t2 to test.
    while (1)
      i++;
and then we may get:
PerfTop:    5847 irqs/sec  kernel:12.4%  exact:  0.0% [4000Hz cycles],  (all, 4 CPUs)
------------------------------------------------------------------------------------------------------------

    82.63%  t2                       [.] 0x00000000000004e5
     0.83%  [alx]                    [k] alx_update_hw_stats
     0.33%  [nvidia]                 [k] _nv013411rm
     0.24%  [kernel]                 [k] update_blocked_averages
     0.24%  nvidia_drv.so            [.] 0x000000000007097b
     0.17%  [kernel]                 [k] pci_conf1_read
     0.17%  [kernel]                 [k] update_load_avg
     0.11%  [alx]                    [k] alx_mask_msix
     0.11%  [kernel]                 [k] _raw_spin_lock_irqsave
     0.11%  [nvidia]                 [k] _nv007492rm
     0.09%  [snd_hda_intel]          [k] pci_azx_readl
     0.09%  [kernel]                 [k] module_get_kallsym
     0.08%  [kernel]                 [k] __switch_to
     0.08%  [kernel]                 [k] __fget
     0.07%  [kernel]                 [k] format_decode
     0.06%  [kernel]                 [k] __schedule
     0.06%  [alx]                    [k] alx_poll
     0.06%  libglib-2.0.so.0.4800.2  [.] 0x0000000000066a85
     0.06%  t2                       [.] 0x00000000000004e1
     0.06%  [kernel]                 [k] copy_user_enhanced_fast_string
     0.06%  [kernel]                 [k] menu_select
It is easy to find that the t2 process has taken up so much cpu.We can use -e to list some process or functions that cause some certain events.
perf record & perf report
$perf record – e cpu-clock ./t1
$perf report
we can get:
# Total Lost Samples: 0
#
# Samples: 1K of event 'cpu-clock'
# Event count (approx.): 268000000
#
# Overhead  Command  Shared Object      Symbol
# ........  .......  .................  .................................
#
    72.11%  t1       t1                 [.] 0x00000000000004f4
    13.34%  t1       t1                 [.] 0x00000000000004ed
    12.59%  t1       t1                 [.] 0x00000000000004e3
     0.75%  t1       [alx]              [k] alx_poll
     0.47%  t1       [kernel.kallsyms]  [k] __softirqentry_text_start
     0.28%  t1       [alx]              [k] alx_mask_msix
     0.09%  t1       [alx]              [k] alx_refill_rx_ring
     0.09%  t1       [kernel.kallsyms]  [k] anon_vma_interval_tree_remove
     0.09%  t1       [kernel.kallsyms]  [k] neigh_lookup
     0.09%  t1       [kernel.kallsyms]  [k] raw_local_deliver
     0.09%  t1       t1                 [.] 0x00000000000004e9


#
# (Tip: Customize output of perf script with: perf script -F event,ip,sym)
#
perf -g record
# Event count (approx.): 261500000
#
# Children      Self  Command  Shared Object      Symbol
# ........  ........  .......  .................  ......................
#
    99.81%     0.00%  t1       libc-2.23.so       [.] 0xffff80eaa5dc2830
            |
            ---0x20830
               |
               |--91.01%--0x557
               |          0x53c
               |          |
               |          |--67.30%--0x4f4
               |          |
               |          |--13.19%--0x4ed
               |          |
               |           --10.42%--0x4e3
               |
                --8.80%--0x561
                          0x514
                          |
                          |--7.07%--0x4f4
                          |
                          |--0.96%--0x4ed
                          |
                           --0.76%--0x4e3

    99.81%     0.00%  t1       [unknown]          [.] 0x088e258d4c544155
            |
            ---0x88e258d4c544155
               0x20830
               ...
               ...
related information
- http://www.brendangregg.com/perf.html
- https://www.ibm.com/developerworks/cn/linux/l-cn-perf2/
- https://www.intel.com/content/www/us/en/architecture-and-technology/64-ia-32-architectures-software-developer-vol-3b-part-2-manual.html